

There is way too much content on the internet these days. More than a billion websites flood the internet with new content daily. With so much content and distractions on the internet, there is no wonder why social media and visual platforms like Snapchat and Instagram are quickly leading the way. However, not all social media platforms are perfect for business and generating new leads.
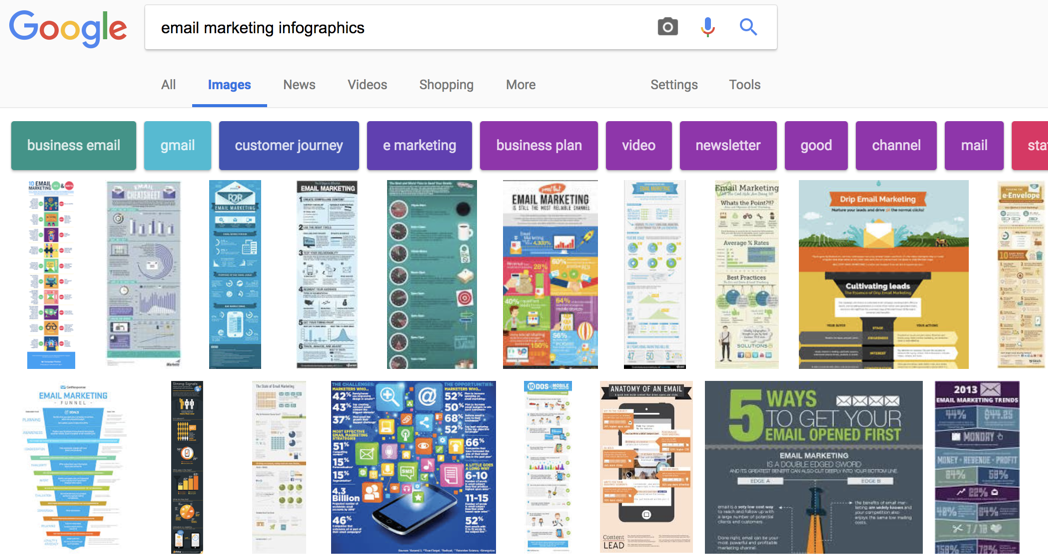
The good news is that any brand or small business can start taking advantage of visual marketing and shorter attention spans, by focusing their efforts on creating and using infographics within their marketing. If you didn’t already know, an infographic is a visual graphic that breaks down the key data points or information of any specific topic. You can see some of the most popular infographic at anytime, simply by searching for “infographics” within Google and going to an “image” search. We did this for you below so you can see a quick example of the many different ’email marketing infographics’ floating around the internet today.
It’s not just about implementing visual marketing into your brand or business, it’s also about making your content more accessible on different platforms and in different ways. Infographics aren’t just easier to view and share, they can also easily be converted into slides and posted to sites like Slideshare as well. We already know there is way too much written content online and the number of junk articles being created and pushed onto users is just too much and seems to be increasing daily.
Visual Content vs. Text Content
Just like many people prefer watching television or going to the movies over reading a book, visual content (images and video) is now the preferred way to absorb information and content for audiences around the world. This is happening for a few different reasons:
- 1. Shorter attention spans than ever before
- 2. Social networks and users prefer visual content and updates
- 3. Visual content is consumed at a master faster pace than text
Even with all of that being said, nearly everyone would rather watch a movie than reading a book, and the same is true for reading content online versus viewing an infographic of YouTube video.
Another reason why infographics are great is that they can be quite cheap (or even free) to create, through the use of online template and software solutions like Canva. Simply choose a template, plug in your own data points, and then go live with it on your site and social media channels.
Infographics are still one of the best and most effective ways to not only reach new audiences and build social shares to your site, they are also great for bringing your existing content to life. However, creating an infographic for your site isn’t something that’s only going to take a few minutes or result in success every time. There is a lot of design work, preparation and promotional work that goes into creating a successful infographic and ad campaign.
To help with this process, we can take a look at some of the best infographic design sizes and tech specs that every brand and marketer should keep in mind when creating content for their sites. You can view the full infographic at Infographic Design Team, while also seeing it’s broken down details below.
Recommended Sizes for Infographics on Websites and Social Media
- For a blog or a general website, you should create an infographic that is not more than 600 pixels, and the length should not exceed 1800 pixels.
- Visually allows you to post infographics of 1240 x 1750 pixels.
- Pinterest allows you to use a size of 600 x infinite pixels. On Pinterest, you can make it as long as you want.
- Facebook allows you to post an infographic with a minimum size of 403 x 403 pixels, and a maximum of up to 2048 pixels by 2048 pixels.
- Google Plus allows you to offer an infographic at a size of 497 x 373 pixels, up to 2048 x 2048 pixels.
- In general, you should create infographics that you want to be viewable by tablet owners by 600-640 pixels.
In addition to the infographic design sizes above, it’s also important to make sure your visual content is backed up by real data, while also representing your brand well in the process. To learn more about how to accomplish this, we can refer to these additional infographic design tips provided by CopyBlogger and Blogging.org, which consist of the following tips:
- 1. Focus on a simple concept – Try not to cover too much information in your infographic, and always stay on point. Some of the most successful infographics have minimal text, which is something many viewers prefer.
- 2. Make your infographic shareable – Visual content is meant to be shared. Make sure you include an embed form on your site and social sharing buttons for Pinterest, Facebook, Twitter and LinkedIn.
- 3. Use a color scheme that matches your brand – Infographics are all about visual design. The co-branding with your current site and brand images and colors should be considered when designing your next infographic.

No matter what industry or niche market you might be in, there is always going to be room for more visual content. Take a look at your best performing content over the years and see which you might want to bring to life with a new infographic design. Don’t forget to implement each of the recommended design sizes and tips before going live with your next infographic.
At the same time, infographics can work extremely well within email marketing as well. When using any type of images or infographics within your mailings, be sure to only include a sample, so users can click over to your site to view the full infographic or whatever it is you have to offer.
If your mailing list isn’t the size you wished it was, be sure to contact us and we will show you how to increase your list with daily 100% opt-in signups through all of our hand-selected partner sites. We specialize in email lead generation and growth marketing, so feel free to reach out with any questions or comments you have.